Preparing a larger number of slides with R code and plots can be a bit
tedious with standard desktop presentation software like powerpoint or keynote.
The manual effort to change the example code, run the analysis and then cut and
paste updated graphs, tables and code is high. Sooner or later one is bound to
create inconsistencies between code and expected results or even syntax errors
Using emacs and its swiss army knife org-mode there is another elegant and
reproducible solution: just export the consistent code and output
from an org-mode code block to generate either slides or bog pages (or both)
from a single source. As a free benefit freen this tool chain can also produce
high quality PDF handouts with a managed table of content and an index.
Org Mode source blocks
Here is a standard statistics “hello world” example using ggplot2:
|
|

The source for the above blog output looks in org mode:
|
|
Note the options in code block header that define whether source and output (including graphics) will be visible on the output page or slide. That’s all it takes to produce the post from the code and consistently re-create all output on the next publish step.
From blog entries to slides
To create visually appealing slides from org-mode there are several
alternatives. For my not too complicated workflow I opted for reveal.js, the java
script package by Hakim El Hattab. The installation and basic usage of this
package from org-mode is described eg in this very nice tutorial by Mike Zamansky.
With a few steps one can create a self consistent presentation
file, which does not require any major software installations for the
presentation viewer apart from a web browser.
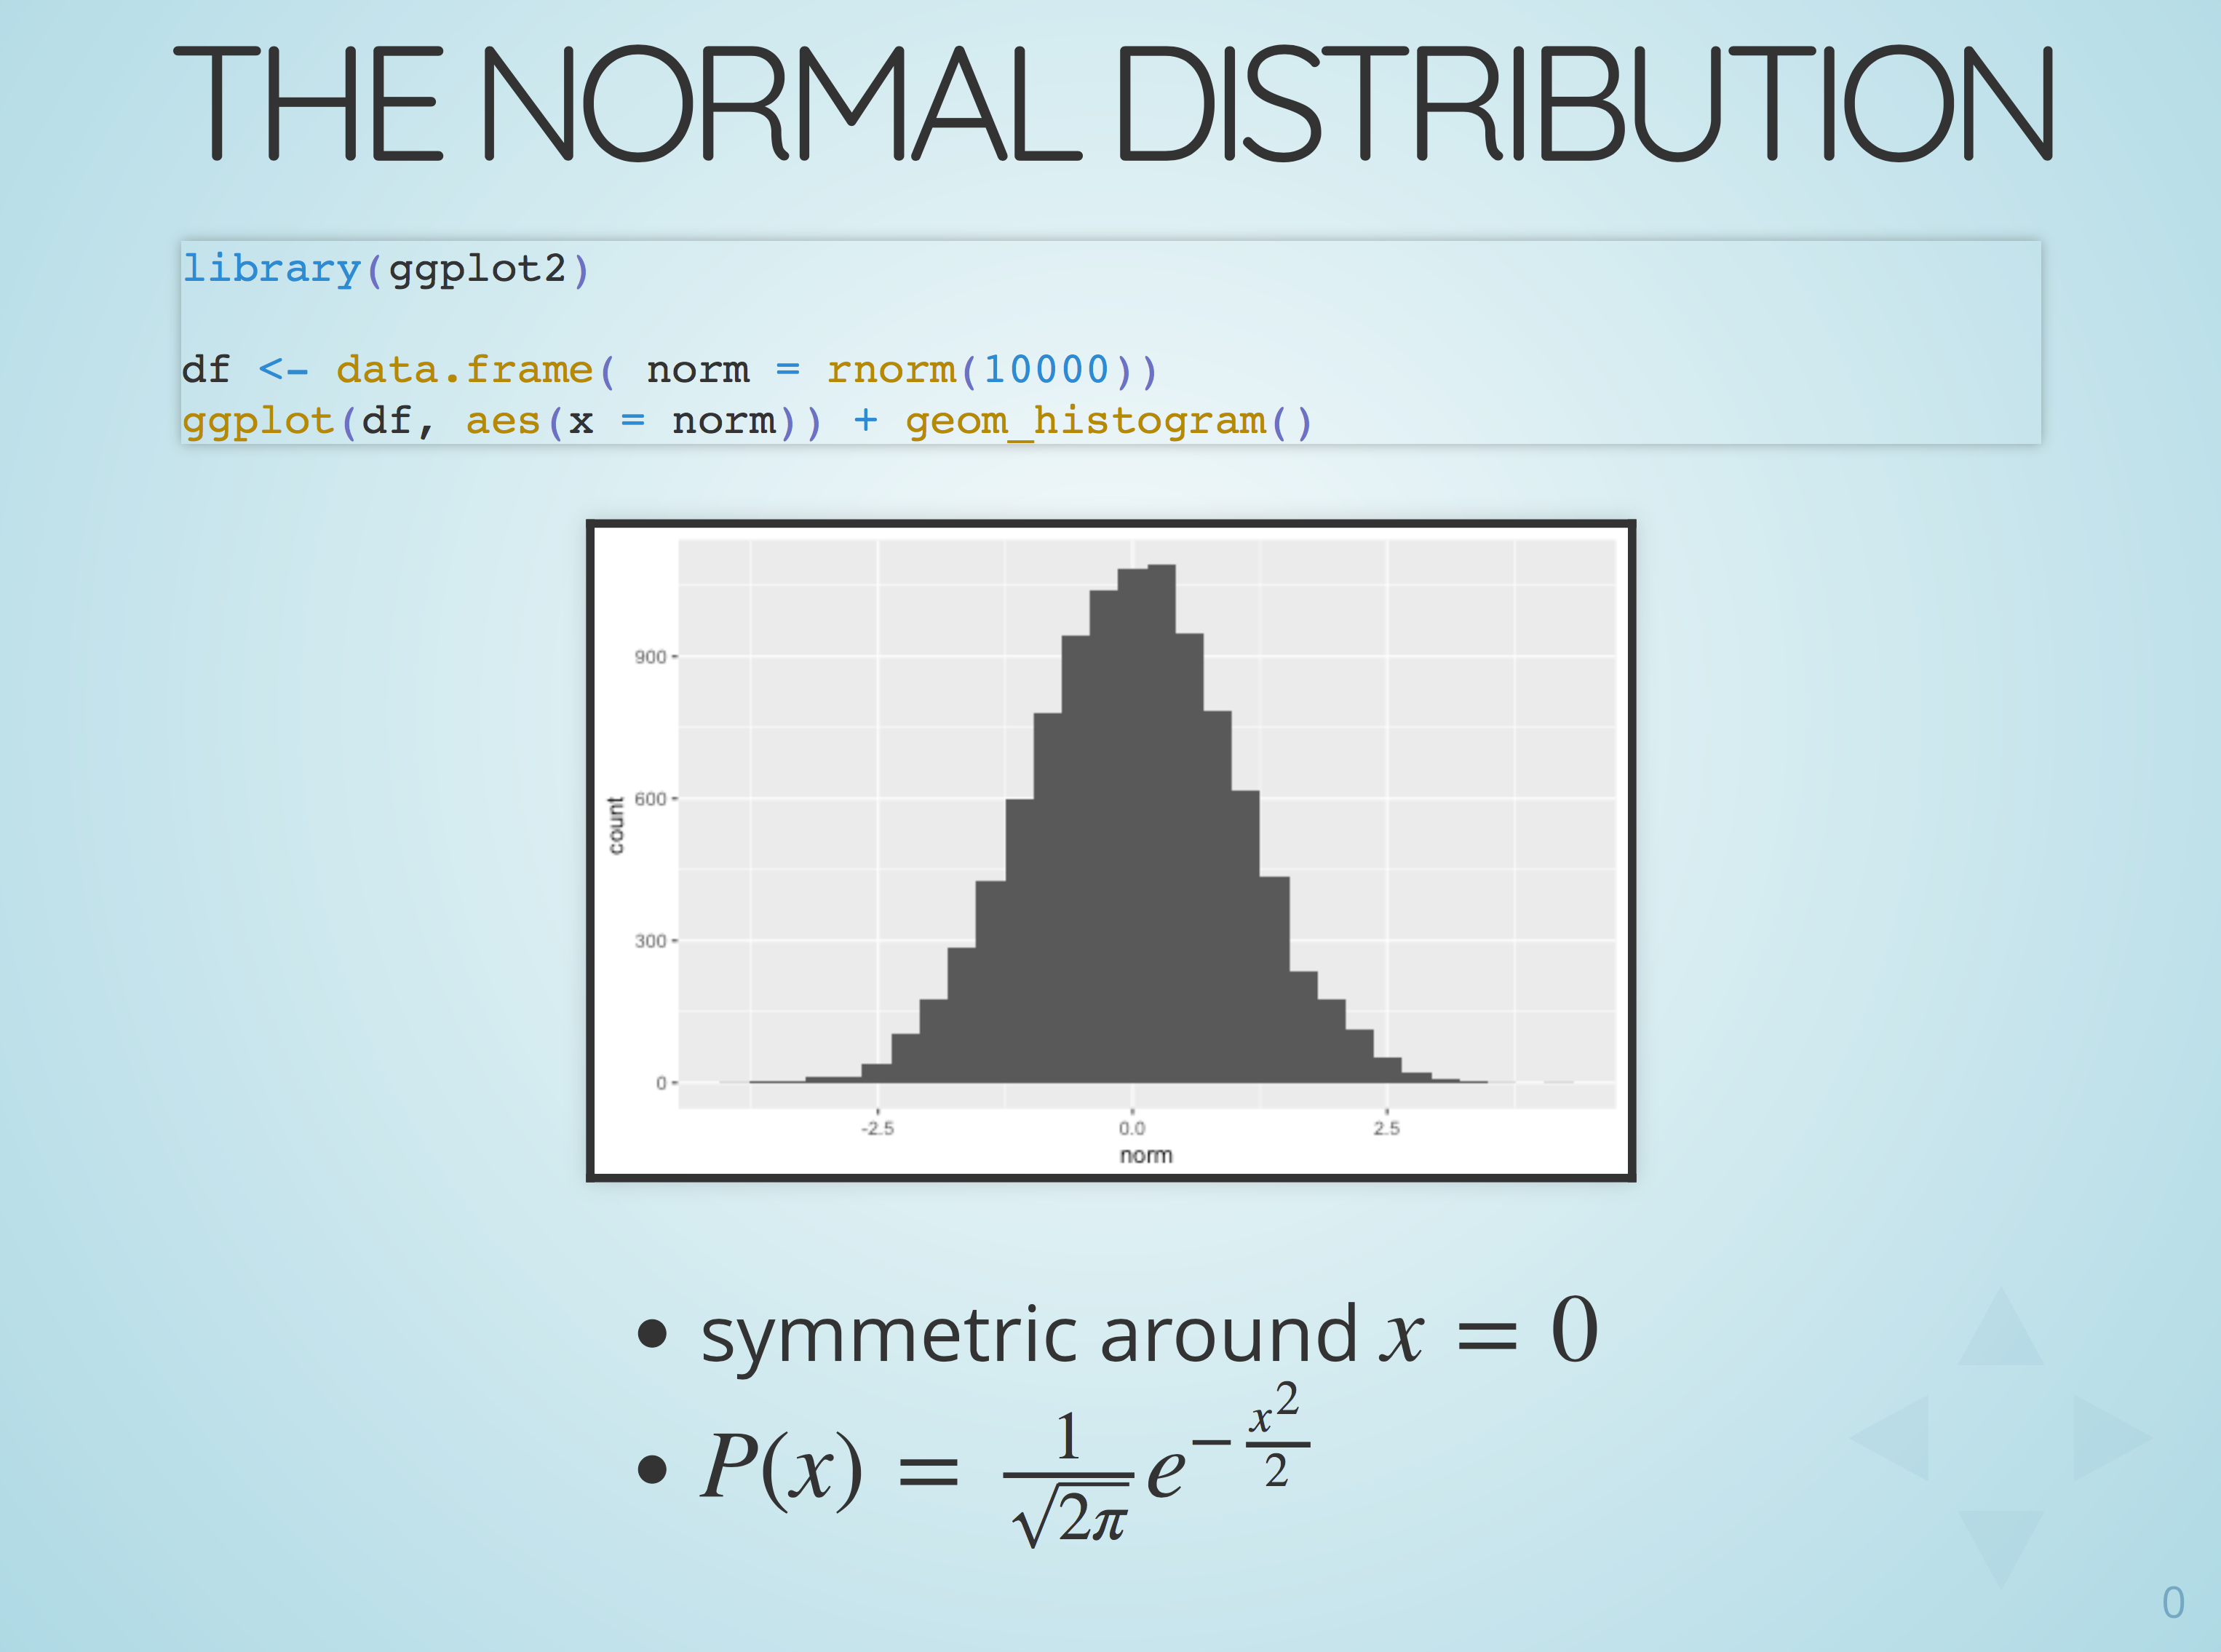
To go from the above org-mode blog source to set of slides is only a small step:
|
|
And here is the result:

Just a png for now, as the blog publishing step needs a fix to allow accessing reveal.js
from my blog hosting side.
